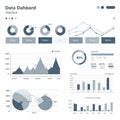
data dashboard featuring circular progress charts pie and bar graphs |
||||||||||||||||||||||||||||||||||||||||
navigate by keyword : writing white trends textual text table statistics sections progress presentation poster pie performance pattern overview orange numerical number multimedia minimalistic metrics logo line likely layout label interpretation interface intended insights information indicating includes gray graphs graphical gadget font featuring easy drawing document diagram design depicting data dashboard comprehensive combination clean circular charts business brand bar art analytics analysis aigenerated advertising |
||||||||||||||||||||||||||||||||||||||||
|
||||||||||||||||||||||||||||||||||||||||
Data dashboard featuring circular progress charts, pie charts, and bar graphs, primarily in orange, gray, and white. The layout includes sections for metrics, line graphs indicating trends, and a table with numerical data. The interface has a clean, minimalistic design intended for data analysis, likely depicting business statistics or performance analytics. The combination of graphical and textual information provides a comprehensive overview for easy interpretation of data trends and insights. |
||||||||||||||||||||||||||||||||||||||||
Stockphotos.ro (c) 2025. All stock photos are provided by Dreamstime and are copyrighted by their respective owners. |