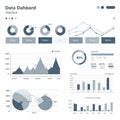
vector data dashboard featuring various charts and graphs includes pie line |
||||||||||||||||||||||||||||||||||||||||
| navigate by keyword : visualization vector text systematic statistical sketch shades segmented screenshot scheme rings representation references progress presentation points plan pie overlapping numeric notations mix minimalist mathematical map logo line layout labels indicators indicating including includes included illustrating grey graphs formats font featuring drawing document diagrams diagram design data dashboard color clean circular circle charts categories cartoon brand blue bar |
||||||||||||||||||||||||||||||||||||||||
|
||||||||||||||||||||||||||||||||||||||||
| Vector data dashboard featuring various charts and graphs. Includes pie charts, line graphs, bar charts, and circular progress indicators. Color scheme is predominantly shades of blue and grey, with text labels indicating different categories and data points. The layout is systematic with a mix of data visualization formats, including segmented rings and overlapping circular diagrams. Mathematical notations and numeric references are included, illustrating statistical data analysis and representation in a clean, minimalist design. |
||||||||||||||||||||||||||||||||||||||||
|
Stockphotos.ro (c) 2025. All stock photos are provided by Dreamstime and are copyrighted by their respective owners. |
||||||||||||||||||||||||||||||||||||||||