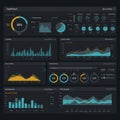
data visualization dashboard featuring various charts and graphs dark

navigate by keyword : visualization type trends text signage sections screenshot represents progress presentation poster pie percentages organized orange number multimedia modern metrics logo line layout labels indicators includes impact graphs generated gadget font featuring employing easy document distributions diagram design data dashboard dark contrasting comparison colors clarity circular circle charts chart cartoon brand blue bar background allowing advertising

Data visualization dashboard featuring various charts and graphs on a dark Royalty Free Stock Photo
Data dashboard featuring various charts and graphs on a dark background. Royalty Free Stock Photo
Data visualization dashboard featuring multiple charts and graphs on a dark Royalty Free Stock Photo
Data dashboard featuring various charts and graphs on a dark background. Includes Royalty Free Stock Photo
Data dashboard with dark theme featuring various charts and graphs. Includes a pie Royalty Free Stock Photo
A large monitor displays a data dashboard featuring various graphs and charts. The Royalty Free Stock Photo
Interactive digital dashboard featuring various data visualization elements on a dark Royalty Free Stock Photo
Data visualization dashboard featuring various charts and graphs on a dark
Data dashboard featuring various graphs and charts on a dark, futuristic interface. Royalty Free Stock Photo
Dark-themed data dashboard featuring various graphs and charts. Includes pie charts Royalty Free Stock Photo
A digital tablet displays a high-tech data dashboard, featuring various graphs, charts, Royalty Free Stock Photo
Digital dashboard featuring various data visualization elements. Includes bar charts, Royalty Free Stock Photo
Digital dashboard featuring various data visualization elements, such as line graphs, Royalty Free Stock Photo
Dashboard featuring various data visualization elements on a dark background. Royalty Free Stock Photo
Futuristic data visualization interface featuring various charts and graphs, including Royalty Free Stock Photo
Data visualization dashboard featuring various charts and graphs on a dark background. Includes line graphs, bar charts, pie charts, and circular progress indicators in orange and blue. Each chart type represents different data metrics, such as percentages, trends, and distributions. The layout is organized into sections with labels, allowing for easy comparison of data. The design is modern, employing contrasting colors for clarity and impact.


Stockphotos.ro (c) 2025. All stock photos are provided by Dreamstime and are copyrighted by their respective owners.