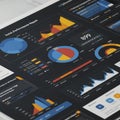
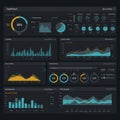
data dashboard featuring various charts and graphs dark background includes |
||||||||||||||||||||||||||||||||||||||||
navigate by keyword : white visually visualization trends time text suitable stage signage show screenshot purposes purple progress presentation present predominant poster pink pie performance percentages number neon metrics market line like indicators includes growth graphs font featuring engaging displays diagrams details designed design depict data dashboard dark contrasting complex colors circular charts categories brand blue bar background analytical |
||||||||||||||||||||||||||||||||||||||||
|
||||||||||||||||||||||||||||||||||||||||
Data dashboard featuring various charts and graphs on a dark background. Includes bar graphs, line charts, pie charts, and circular progress indicators. Predominant colors are neon pink, blue, and purple, with contrasting white text and details. Displays data in categories like market trends, growth analysis, and metrics visualization. Circular diagrams show percentages, while line and bar graphs depict trends over time. Designed to present complex data in a visually engaging way, suitable for analytical purposes. |
||||||||||||||||||||||||||||||||||||||||
Stockphotos.ro (c) 2025. All stock photos are provided by Dreamstime and are copyrighted by their respective owners. |