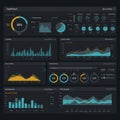
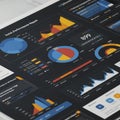
data dashboard featuring various graphs and charts dark background includes |
||||||||||||||||||||||||||||||||||||||||
navigate by keyword : visual vibrant vehicle values use trends text suggesting signage segmented sections screenshot purple progress presentation plots placeholder pie percentage organized orange number multimedia modular metrics machine line like layout labels intelligence indicators includes hierarchy graphs games gadget font featuring emphasize electronics display diagram data dashboard dark comparisons colors clear circular circle charts business brand blue bars bar background applications analysis aigenerated advertising |
||||||||||||||||||||||||||||||||||||||||
|
||||||||||||||||||||||||||||||||||||||||
Data dashboard featuring various graphs and charts on a dark background. Includes pie charts, bar graphs, and line graphs with vibrant colors like blue, orange, and purple. Percentage values and data labels emphasize metrics. Circular progress indicators, segmented bars, and line plots display trends and comparisons. The layout is modular, with sections organized for clear visual hierarchy, suggesting applications in data analysis or business intelligence. Labels and text use placeholder content. |
||||||||||||||||||||||||||||||||||||||||
Stockphotos.ro (c) 2025. All stock photos are provided by Dreamstime and are copyrighted by their respective owners. |