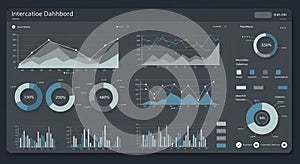
data visualization dashboard featuring multiple charts and graphs dark |
||||||||||||||||||||||||||||||||||||||||
navigate by keyword : visualization top text sleek show shades screenshot progress presentation poster placeholder pie percentage pattern organized number navigation multiple multimedia modern metrics menu marked logo line layout interfaces interactivity indicators includes gray graphs generated gadget font featuring enhancing elements drawing document displaying diagram design data dashboard dark circular circle charts cartoon capabilities brand blue bar background analytical advertising 480 350 250 150 |
||||||||||||||||||||||||||||||||||||||||
|
||||||||||||||||||||||||||||||||||||||||
Data visualization dashboard featuring multiple charts and graphs on a dark background. Includes line graphs, bar charts, and pie charts displaying various data metrics. Elements show percentage indicators, such as 3.50% and 88%, and circular progress indicators marked with 150%, 250%, and 480%. The layout is organized with a modern, sleek design using shades of blue and gray. Top section includes a navigation menu and placeholder text, enhancing the interface's interactivity and analytical capabilities. |
||||||||||||||||||||||||||||||||||||||||
Stockphotos.ro (c) 2025. All stock photos are provided by Dreamstime and are copyrighted by their respective owners. |