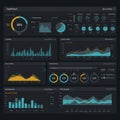
dashboard featuring various data visualization elements dark background |
||||||||||||||||||||||||||||||||||||||||
| navigate by keyword : yellows visualization usage trends text structured signage separating segmented sections screenshot progress presentation pie percentages panels oranges number multiple multimedia metrics line layout labeled individual indicators includes headers graphs games gadget font featuring feature enhancing energy elements electronics differentiation diagram design data dashboard dark colors circular circle charts brand blues bar background analysis aigenerated |
||||||||||||||||||||||||||||||||||||||||
|
||||||||||||||||||||||||||||||||||||||||
| Dashboard featuring various data visualization elements on a dark background. Includes pie charts, bar graphs, line graphs, circular progress indicators, and segmented charts. Each section is labeled with various metrics and percentages, such as energy usage and analysis of trends. Colors predominantly feature blues, yellows, and oranges, enhancing data differentiation. The layout is structured into multiple panels with headers separating individual sections. |
||||||||||||||||||||||||||||||||||||||||
|
Stockphotos.ro (c) 2025. All stock photos are provided by Dreamstime and are copyrighted by their respective owners. |
||||||||||||||||||||||||||||||||||||||||