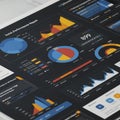
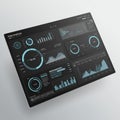
dashboard interface featuring various data visualizations dark background |
||||||||||||||||||||||||||||||||||||||||
navigate by keyword : visualizations values use trends tones time text technology sleek signage sets screenshot red readability presentation pie percentage panels organized offering number multiple multimedia monitoring modern metrics line likely lighting light layout interface insights includes gridlike grey graphs gadget font featuring environments elements electronics easy displays diagram design data dashboard dark charts business brand blue bar background |
||||||||||||||||||||||||||||||||||||||||
|
||||||||||||||||||||||||||||||||||||||||
Dashboard interface featuring various data visualizations on a dark background. Includes line graphs, bar charts, and pie charts in red, blue, and grey tones. Each section displays metrics such as percentage values and trends over time. The layout is grid-like with multiple panels containing different data sets, offering an organized presentation for monitoring analytics. The design is modern and sleek, likely for use in business or technology environments. Elements are arranged for easy readability and immediate data insights. |
||||||||||||||||||||||||||||||||||||||||
Stockphotos.ro (c) 2025. All stock photos are provided by Dreamstime and are copyrighted by their respective owners. |