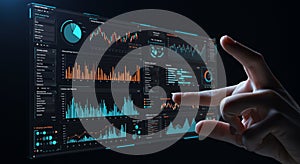
interactive digital dashboard interface featuring various data visualizations including

navigate by keyword : visualizations used text technology systems stage signage selecting screenshot screen represents realtime presentation pie person orange multimedia monitoring manipulating line likely like interface interactive interacting insights including hues holographic hand graphs gesturing generated games gadget font finance fields featuring electronics display digital design decisionmaking data dashboard dark complex charts brand blue bar background analytics advertising

Interactive digital dashboard interface featuring various data visualizations, including Royalty Free Stock Photo
Futuristic digital dashboard displaying various data visualizations including circular Royalty Free Stock Photo
Futuristic digital interface displaying various data visualizations, including bar graphs, Royalty Free Stock Photo
An angled close-up of a digital dashboard display featuring various data Royalty Free Stock Photo
Futuristic user interface design featuring a layered digital dashboard. It includes Royalty Free Stock Photo
   
Futuristic AI Control Panel Royalty Free Stock Photo
Interactive digital dashboard interface featuring various data visualizations, including
Digital dashboard interface for a Customer Relationship Management (CRM) tool, Royalty Free Stock Photo
Mobile Application Interface with Modern Analytics Dashboard Design Royalty Free Stock Photo
Advanced Industrial Control Panel with Futuristic Interface Royalty Free Stock Photo
Futuristic Data Analysis Interface Royalty Free Stock Photo
Modern User Interface Dashboard Design Featuring Data Visualization Tools and Calendar Layout During Evening Hours Royalty Free Stock Photo
Futuristic HUD Interface Featuring Data Visualizations, Graphs, and Charts Royalty Free Stock Photo
Advanced Digital Interface Design Featuring Interactive Data Visualizations and Futuristic Elements in a Dark Theme Royalty Free Stock Photo
Interactive digital dashboard interface featuring various data visualizations, including bar graphs, line charts, and pie charts. The display is primarily in blue and orange hues on a dark background. A hand is seen interacting with the holographic screen, gesturing as if selecting or manipulating the data. The dashboard likely represents complex data analytics or monitoring systems, possibly used in fields like finance or technology for real-time insights and decision-making.


Stockphotos.ro (c) 2025. All stock photos are provided by Dreamstime and are copyrighted by their respective owners.