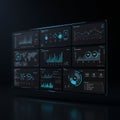
digital dashboard featuring multiple data visualizations includes line graphs bar |
||||||||||||||||||||||||||||||||||||||||
navigate by keyword : visualizations visible typical turquoise trends text suggesting statistical stage software signage shows shades screenshot red progress points pie performance panels number neon multiple multimedia monitoring line light layout interfaces includes grid graphs gauge gadget font focus fluctuating financial featuring enhances electronics display digital detailed data dashboard dark contrast circular charts brand blue bar background axes arranged analytical |
||||||||||||||||||||||||||||||||||||||||
|
||||||||||||||||||||||||||||||||||||||||
Digital dashboard featuring multiple data visualizations. Includes line graphs, bar charts, and pie charts in shades of red, blue, and turquoise. Graphs display fluctuating trends, possibly financial or statistical data. Circular progress gauge shows 100%. Dark background enhances contrast and focus. Panels are arranged in a grid layout, typical of analytical software interfaces. Data points and axes are visible, suggesting detailed monitoring or analysis. |
||||||||||||||||||||||||||||||||||||||||
Stockphotos.ro (c) 2025. All stock photos are provided by Dreamstime and are copyrighted by their respective owners. |