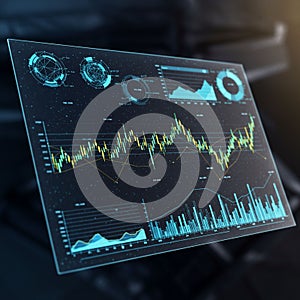
digital interface displays multiple data visualizations including line graphs bar |
||||||||||||||||||||||||||||||||||||||||
navigate by keyword : yellow watering visualizations vibrant trends theme text surrounded suggesting sits signage show segmented screenshot screen represent points peaks patterns number multiple multimedia monitoring metal lush lines line lighting light lawn interface indicate including hightech highlighting green graphs gadget futuristic font focused fluctuations flowers features environment electronics displays digital diagrams design data darkness dark colorful circular charts brown brand bottom blue black |
||||||||||||||||||||||||||||||||||||||||
|
||||||||||||||||||||||||||||||||||||||||
A digital interface displays multiple data visualizations, including line graphs, bar charts, and circular charts. The screen features a dark background with colorful lines in yellow and blue, highlighting trends and fluctuations. Circular diagrams show segmented data, while line graphs indicate patterns and peaks. The bar charts at the bottom represent various data points. The overall theme is futuristic and analytical, suggesting a high-tech environment focused on data analysis and monitoring. |
||||||||||||||||||||||||||||||||||||||||
Stockphotos.ro (c) 2025. All stock photos are provided by Dreamstime and are copyrighted by their respective owners. |