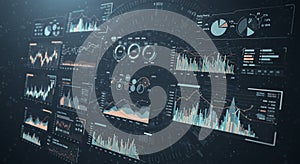
digital dashboard displays multiple data visualizations including line graphs bar |
||||||||||||||||||||||||||||||||||||||||
navigate by keyword : visualizations trends text system suggesting style statistics skyscraper skyline showcase segmented screenshot scientific representing processing presented precision poster pie pattern multiple metropolis metrics line likely iron interface information including hightech graphs glowing generated futuristic font financial emphasize elements displays digital dials detailed design datadriven data dashboard dark city circular charts business brand blue bar background art areas analytics analysis aesthetic advertising advanced |
||||||||||||||||||||||||||||||||||||||||
|
||||||||||||||||||||||||||||||||||||||||
A digital dashboard displays multiple data visualizations, including line graphs, bar charts, and pie charts. Various metrics and analytics are presented in a futuristic style, with a dark background and glowing elements. The charts showcase trends and statistics, likely representing financial, business, or scientific data. The interface has a high-tech, data-driven aesthetic, suggesting an advanced information processing system. Circular dials and segmented areas emphasize precision and detailed analysis. |
||||||||||||||||||||||||||||||||||||||||
Stockphotos.ro (c) 2025. All stock photos are provided by Dreamstime and are copyrighted by their respective owners. |