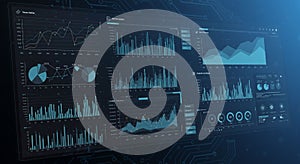
digital dashboard displays multiple data visualizations including line graphs bar |
||||||||||||||||||||||||||||||||||||||||
navigate by keyword : visualizations trends time theme text technological statistical stage sleek signage show shades screenshot representing poster pie patterns optimized number multiple multimedia modern metrics line likely light labels interface interactive including gray graphs gadget font financial features emphasizing elements electronics displays digital design data dashboard darkness comparisons clear circuit charts business brand blue bar background analysis aigenerated advertising abstract |
||||||||||||||||||||||||||||||||||||||||
|
||||||||||||||||||||||||||||||||||||||||
A digital dashboard displays multiple data visualizations, including line graphs, bar charts, and pie charts, in shades of blue and gray. The various charts show trends, comparisons, and statistical data over time, likely representing financial or business metrics. The interface design is modern and sleek, optimized for data analysis, with clear labels and interactive elements. The background features abstract circuit patterns, emphasizing a technological theme. |
||||||||||||||||||||||||||||||||||||||||
Stockphotos.ro (c) 2025. All stock photos are provided by Dreamstime and are copyrighted by their respective owners. |