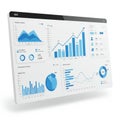
digital dashboard displays multiple data visualizations including bar charts pie |
||||||||||||||||||||||||||||||||||||||||
navigate by keyword : widgets visualizations usage tracking text suggesting specific smartphone shades sections screenshot presentation points pie performance percentages numerical multiple multimedia modern metrics line label kpis kpi key interface indicators including includes highlighted graphs gadget font figures electronics effect document displays digital diagram design data dashboard clean charts cash business budget brand blue bar applications angled analytics aigenerated advertising 580 |
||||||||||||||||||||||||||||||||||||||||
|
||||||||||||||||||||||||||||||||||||||||
A digital dashboard displays multiple data visualizations, including bar charts, pie charts, and line graphs, predominantly in shades of blue. Key performance indicators (KPIs) and other metrics are highlighted, with percentages and numerical data. The interface includes various widgets and sections for specific data points, such as "KPI: 580" and budget figures. The design is clean, modern, and angled for a 3D effect, suggesting usage in business analytics or data tracking applications. |
||||||||||||||||||||||||||||||||||||||||
Stockphotos.ro (c) 2025. All stock photos are provided by Dreamstime and are copyrighted by their respective owners. |