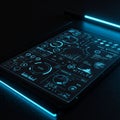
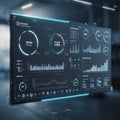
digital interface displays various data visualizations and analytics features |
||||||||||||||||||||||||||||||||||||||||
navigate by keyword : visualizations visualization utilizing types text technology suggests stage signage search screenshot purple processing presentation poster pie perspective numerical number multiple market line likely light layout interface indicators including hightech graphs graphical gradient giving generated futuristic font focus financial features elements displays digital diagram design datasets data dashboard cool combination color circular charts chart brand blue bars bar banner arranged analytics analysis ambiance advertising |
||||||||||||||||||||||||||||||||||||||||
|
||||||||||||||||||||||||||||||||||||||||
A digital interface displays various data visualizations and analytics. It features multiple chart types, including bar graphs, line graphs, and pie charts. There are numerical and graphical datasets alongside dashboard elements, such as search bars and circular indicators. The layout is arranged in a 3D perspective with a cool color gradient of blue and purple, giving a futuristic, high-tech ambiance. The combination of these elements suggests a focus on financial or market analysis, likely utilizing AI technology for processing and visualization. |
||||||||||||||||||||||||||||||||||||||||
Stockphotos.ro (c) 2025. All stock photos are provided by Dreamstime and are copyrighted by their respective owners. |