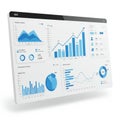
digital interface displays multiple data visualizations including bar graphs line |
||||||||||||||||||||||||||||||||||||||||
navigate by keyword : visualizations tracking text teal suggesting stage signage screenshot quick presentation poster pie performance percentages numerical number night multiple line likely light layout labels interpretation interface intelligence including hues hightech highlighting graphs glowing generated futuristic font financial features facilitates displays digital design decisionmaking data darkness dark creating charts business brand blue bar banner backdrop appearance analytics analysis advertising |
||||||||||||||||||||||||||||||||||||||||
|
||||||||||||||||||||||||||||||||||||||||
A digital interface displays multiple data visualizations, including bar graphs, line charts, and pie charts. The interface features percentages, numerical data, and labels, suggesting analytics or financial tracking. The backdrop is dark, with glowing blue and teal hues highlighting the charts, creating a futuristic and high-tech appearance. The layout is likely for data analysis or business intelligence, with a design that facilitates quick data interpretation and decision-making. |
||||||||||||||||||||||||||||||||||||||||
Stockphotos.ro (c) 2025. All stock photos are provided by Dreamstime and are copyrighted by their respective owners. |