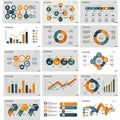
collection infographics featuring various charts and graphs includes pie

navigate by keyword : visually visualization trends text techniques teal suitable statistical showcasing sheets shades screenshot resembling reports presented presentations presentation pie percentage orange number notepads multimedia materials logo line learning key information infographics includes illustrating hierarchical gray graphs graphics gadget format font figures featuring engaging emphasize elements educational drawing document diagram design depict data comparisons collection circle charts cartoon business breakdowns brand bar analytical aigenerated advertising

Collection of infographics featuring various charts and graphs. Includes pie charts, Royalty Free Stock Photo
Collection of infographics, featuring various charts and graphs. Includes world maps Royalty Free Stock Photo
Collection of infographics featuring various charts and graphs. Includes line graphs, Royalty Free Stock Photo
Collection of infographics and data visualizations featuring various charts and Royalty Free Stock Photo
Collection of 3D infographics featuring bar graphs, line charts, and a pie chart. Royalty Free Stock Photo
   
   
Collection of infographics featuring various charts and graphs. Includes pie charts,
Collection of infographics and charts featuring mathematical and scientific concepts. Royalty Free Stock Photo
A collection of dark-themed data visualizations and infographics featuring various Royalty Free Stock Photo
   
A stock illustration of business infographic elements, comprising charts and icons, designed for effective data communication. Royalty Free Stock Photo
A set of business infographic elements, showcasing diverse charts and icons, ideal for informative and engaging presentations. Royalty Free Stock Photo
Collection of abstract data visualization icons in a grid layout, featuring various Royalty Free Stock Photo
Collection of infographics featuring various chart types and data visualizations Royalty Free Stock Photo
Collection of infographics featuring various charts and graphs. Includes pie charts, bar graphs, and line charts in shades of orange, teal, and gray. Some graphics depict statistical data with percentage breakdowns, while others emphasize hierarchical information. Elements are presented on sheets, resembling reports or notepads, illustrating data visualization and information design techniques. Suitable for business presentations, educational materials, or analytical reports, showcasing trends, comparisons, and key figures in a visually engaging format.


Stockphotos.ro (c) 2025. All stock photos are provided by Dreamstime and are copyrighted by their respective owners.