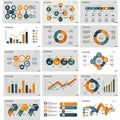
collection infographics featuring bar graphs line charts and pie chart

navigate by keyword : wellstructured visuals use text smooth shows sets screenshot scheme rounded rectangular presentations presentation pie percentages panels orange multimedia logo line legend layouts labels label infographics infographic includes icons gray graphs graphics gadget font featuring engagement emphasizing edges drawing document display diagram designed design data connected colors color collection clarity circular circle charts chart cartoon brand bottom blue bar aigenerated

Collection of 3D infographics featuring bar graphs, line charts, and a pie chart. Royalty Free Stock Photo
A collection of infographics featuring bar graphs, line charts, pie charts, and circular Royalty Free Stock Photo
Collection of infographics featuring various chart types, including bar, line, pie, and Royalty Free Stock Photo
Collection of colorful infographics featuring various chart types: bar graphs, pie Royalty Free Stock Photo
Collection of infographics featuring various chart types including line graphs, pie Royalty Free Stock Photo
   
   
Collection of 3D infographics featuring bar graphs, line charts, and a pie chart.
Collection of infographics featuring various chart types and data visualizations Royalty Free Stock Photo
A collection of infographics displayed on a light gray background, featuring various Royalty Free Stock Photo
   
   
Stunning 3D Bokeh Infographic Elements Data Visualization and Business Presentations with Impactful Charts and Graphs Royalty Free Stock Photo
A stock illustration of business infographic elements, comprising charts and icons, designed for effective data communication. Royalty Free Stock Photo
A collection of dark-themed data visualizations and infographics featuring various Royalty Free Stock Photo
Collection of 3D infographics featuring bar graphs, line charts, and a pie chart. The graphics use a color scheme of orange, blue, and gray, with smooth, rounded edges on rectangular panels. The charts display various data sets, with labels and icons for clarity. The pie chart includes a legend with corresponding colors. A circular infographic at the bottom shows percentages with connected icons. These visuals are designed for presentations, emphasizing clarity and engagement through well-structured layouts.


Stockphotos.ro (c) 2025. All stock photos are provided by Dreamstime and are copyrighted by their respective owners.