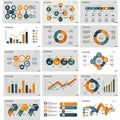
collection infographics featuring various chart types and data visualizations

navigate by keyword : visualizations visual types text style structured shades sections screenshot reports presented presentations presentation pie percentage panel palette orange numbered number multimedia logo line like label information infographics includes icons gray graphs formats font flow featuring elements effectively drawing dominant document diagrams diagram designed design data create convey consistent complex colors color collection coherence circle charts chart cartoon brand blue bar aigenerator advertising

Collection of infographics featuring various chart types and data visualizations Royalty Free Stock Photo
A collection of vibrant infographics featuring various chart types, including bar, line, Royalty Free Stock Photo
Collection of infographics featuring various chart types including line graphs, pie Royalty Free Stock Photo
A collection of dark-themed data visualizations and infographics featuring various Royalty Free Stock Photo
Collection of data visualizations in monochrome style, featuring line, bar, and pie Royalty Free Stock Photo
   
   
Collection of infographics featuring various chart types and data visualizations
Abstract 3D Data Visualization and Analytics Royalty Free Stock Photo


Collection of infographics featuring various chart types and data visualizations. Each panel includes elements like bar graphs, pie charts, line graphs, and flow diagrams. Dominant colors are shades of blue, orange, and gray. Information is presented in structured formats with numbered sections, icons, and percentage data. Designed to convey complex data clearly and effectively for presentations or reports. The consistent color palette and style create visual coherence across the different infographics.


Stockphotos.ro (c) 2025. All stock photos are provided by Dreamstime and are copyrighted by their respective owners.