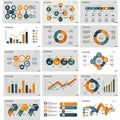
collection infographics and data visualizations featuring various charts |
||||||||||||||||||||||||||||||||||||||||
navigate by keyword : world wide visualizations various throughout text suitable styles structured showcasing screenshot representation relationships range processes presentations presentation pie percentage pattern organized orange number maps logo lines line layout infographics indicators includes image illustration gray graphs graphics font flow finance featuring elements drawing document diagram design depict data connecting collection circular circle charts cartoon business brand blue bar arrows appear analytical advertising |
||||||||||||||||||||||||||||||||||||||||
|
||||||||||||||||||||||||||||||||||||||||
Collection of infographics and data visualizations featuring various charts and graphs in blue, orange, and gray. Includes bar charts, line graphs, pie charts, and world maps. Some graphics depict data relationships and flow processes with arrows and connecting lines. Circular charts and percentage indicators appear throughout, with some 3D elements. The layout is structured and organized, showcasing a wide range of data representation styles, suitable for business, finance, or analytical presentations. |
||||||||||||||||||||||||||||||||||||||||
Stockphotos.ro (c) 2025. All stock photos are provided by Dreamstime and are copyrighted by their respective owners. |