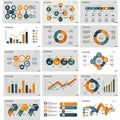
collection infographics featuring various charts and graphs includes line |
||||||||||||||||||||||||||||||||||||||||
navigate by keyword : visually values text suitable statistical specific sketch show shades segments presenting presentation points pie percentages organized numerical multimedia minimalistic markers map logo line labels information infographics indicate includes help grey graphs format font featuring elements drawing donut dominated document distribution displaying diagram design data collection clean circle charts cartoon brand blue bar aigenerated advertising |
||||||||||||||||||||||||||||||||||||||||
|
||||||||||||||||||||||||||||||||||||||||
Collection of infographics featuring various charts and graphs. Includes line graphs, bar charts, pie charts, and donut charts, displaying data with percentages and numerical values. Dominated by shades of blue and grey, the design is clean and minimalistic. Elements show distribution percentages and numerical data points. Labels and markers help indicate specific data segments. Suitable for presenting statistical information in a visually organized format. |
||||||||||||||||||||||||||||||||||||||||
Stockphotos.ro (c) 2025. All stock photos are provided by Dreamstime and are copyrighted by their respective owners. |