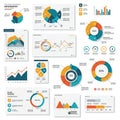
collection data visualizations including various bar charts pie and line

navigate by keyword : writing visualizations vertical varying values used use typically types trends text statistical signage sheets sets segments schemes representation reports red presentations presentation poster points pie pattern paper numerical multiple logo lines line label information indicating including heights graphs font features feature effectively drawing document display differentiate diagram design data connecting communicate colored color collection charts chart categories categorical cartoon brand blue

Collection of various data visualizations, including bar charts, line graphs, pie charts, Royalty Free Stock Photo
A collection of various data visualizations including bar charts, line graphs, and pie Royalty Free Stock Photo
Collection of data visualizations, including various bar charts, pie charts, and line Royalty Free Stock Photo
Collection of data visualizations, including bar and line charts, pie graphs, and Royalty Free Stock Photo
A collection of data visualizations including line graphs, bar charts, and pie charts. Royalty Free Stock Photo
Collection colorful isometric 3D graphs charts including bar, line, pie graphs, good presentation Royalty Free Stock Photo
Collection of data visualizations, including various bar charts, pie charts, and line
Collection of data visualizations including bar graphs, line charts, pie charts, and area Royalty Free Stock Photo
A collection of twelve data visualizations, including bar graphs, line charts, pie charts, Royalty Free Stock Photo
A collection of data visualizations featuring various graph types, including bar charts, Royalty Free Stock Photo
A collection of various 3D charts and graphs, including bar graphs, line graphs, and pie Royalty Free Stock Photo
A collection of various infographic elements including line charts, bar graphs, pie Royalty Free Stock Photo
Collection of various graphs and charts, including line graphs, bar charts, pie charts, Royalty Free Stock Photo
Infographic collection featuring various data visualizations including pie charts, line Royalty Free Stock Photo
Collection of data visualizations, including various bar charts, pie charts, and line graphs on sheets of paper. The charts predominantly use blue and red color schemes to differentiate data sets. The pie chart features multiple colored segments for categorical data representation. Bar charts display vertical bars of varying heights indicating numerical values, while line graphs feature lines connecting data points across categories. These types of visualizations are typically used in reports and presentations to effectively communicate statistical information and trends.


Stockphotos.ro (c) 2025. All stock photos are provided by Dreamstime and are copyrighted by their respective owners.