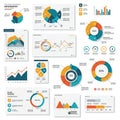
collection various data visualizations including bar charts pie line graphs |
||||||||||||||||||||||||||||||||||||||||
navigate by keyword : visualizations use text teal systematic suitable structured statistical shapes sections screenshot rectangles professional presentation pie percentage pattern orange number multimedia modern markers logo line labeled information infographics including hues graphs generated font effectively drawing document display diagram designed design data convey contexts collection circles circle charts cartoon business brand blue bar axes arrangement area analytical aesthetic advertising |
||||||||||||||||||||||||||||||||||||||||
|
||||||||||||||||||||||||||||||||||||||||
A collection of various data visualizations, including bar charts, pie charts, line graphs, and area graphs in orange, teal, and blue hues. The charts display different statistical data with axes, percentage markers, and labeled sections. Infographics use shapes such as circles and rectangles for structured data presentation. The arrangement is systematic, designed to convey information clearly and effectively. The overall aesthetic is modern and professional, suitable for business or analytical contexts. |
||||||||||||||||||||||||||||||||||||||||
Stockphotos.ro (c) 2025. All stock photos are provided by Dreamstime and are copyrighted by their respective owners. |