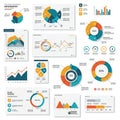
infographic collection featuring various data visualizations including pie charts line |
||||||||||||||||||||||||||||||||||||||||
navigate by keyword : yellow visualizations use understanding trends time text teal statistics shades sets segment sections screenshot rounded presentation pie person percentages parts organized orange offering multimedia logo line layout labeled insights information infographic including illustrate icons graphs font fluctuating featuring facilitating easy drawing document distinguishable display diagrams diagram data complex comparison comparative collection clean circular circle charts cartoon brand bar aigenerated advertising accompany |
||||||||||||||||||||||||||||||||||||||||
|
||||||||||||||||||||||||||||||||||||||||
Infographic collection featuring various data visualizations including pie charts, line graphs, and bar charts. Circular diagrams use shades of orange, teal, and yellow for sections labeled with percentages. Line graphs display fluctuating trends over time. Rounded diagrams segment information into distinguishable parts. Bar charts illustrate comparative data. Icons accompany text, offering insights or statistics. Overall layout is clean and organized, facilitating easy comparison and understanding of complex data sets. |
||||||||||||||||||||||||||||||||||||||||
Stockphotos.ro (c) 2025. All stock photos are provided by Dreamstime and are copyrighted by their respective owners. |