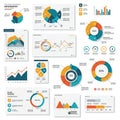
collection various data visualizations including bar charts line graphs and pie

navigate by keyword : yellow visualizations values trends time three text suitable statistical sketch show sets screenshot rows representations reporting red presentation poster plan pie percentage pattern palette organized multiple map line layout information indicate including illustrate graphs generated font emphasizing drawing document distributions distinguish display diagram design data complex comparative combine collection clear circle charts chart categories cartoon business brand blue bar analytical analysis advertising

Collection of various data visualizations, including bar charts, line graphs, pie charts, Royalty Free Stock Photo
A collection of various data visualizations including bar charts, line graphs, and pie Royalty Free Stock Photo
Collection of data visualizations, including bar and line charts, pie graphs, and Royalty Free Stock Photo
A collection of data visualizations including line graphs, bar charts, and pie charts. Royalty Free Stock Photo
Collection of data visualizations including bar graphs, line charts, pie charts, and area Royalty Free Stock Photo
A collection of data visualizations featuring various graph types, including bar charts, Royalty Free Stock Photo
Collection of data visualizations, including various bar charts, pie charts, and line Royalty Free Stock Photo
A collection of various data visualizations including bar charts, line graphs, and pie
A collection of twelve data visualizations, including bar graphs, line charts, pie charts, Royalty Free Stock Photo
Collection of various graphs and charts, including line graphs, bar charts, pie charts, Royalty Free Stock Photo
Infographic collection featuring various data visualizations including pie charts, line Royalty Free Stock Photo
Collection colorful isometric 3D graphs charts including bar, line, pie graphs, good presentation Royalty Free Stock Photo
A collection of various 3D charts and graphs, including bar graphs, line graphs, and pie Royalty Free Stock Photo
A collection of various infographic elements including line charts, bar graphs, pie Royalty Free Stock Photo
A collection of various data visualizations including bar charts, line graphs, and pie charts. Each chart uses a palette of blue, red, and yellow to distinguish different data sets or categories. Bar charts show comparative values, while line graphs indicate trends over time. Pie charts display percentage distributions. Some graphs combine multiple data representations to illustrate complex information. The overall layout is organized in three rows, emphasizing a clear, analytical presentation of data suitable for statistical analysis or business reporting.


Stockphotos.ro (c) 2025. All stock photos are provided by Dreamstime and are copyrighted by their respective owners.