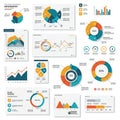
collection data visualizations including bar and line charts pie graphs |
||||||||||||||||||||||||||||||||||||||||
navigate by keyword : visualizations used themes text technological symbols style statistics sketch show sets segments sections screenshot reports reflects rectangular radar professional presentations presentation present plan placeholder pie performance percentages orange multimedia metrics map logo location line legends labeled infographics indicating including illustrate icons graphs generated gears font drawing dominant document display diagram design depict data comparative commonly colors collection circular charts cartoon calendar business brand blue bar |
||||||||||||||||||||||||||||||||||||||||
|
||||||||||||||||||||||||||||||||||||||||
Collection of data visualizations, including bar and line charts, pie graphs, and infographics. Dominant colors are blue and orange, with various sections labeled with placeholder text. Circular icons depict gears, calendar, and location symbols, indicating business and technological themes. Charts present different data sets with axes and legends, while pie charts display segments with percentages. Rectangular graphs show comparative statistics, and radar charts illustrate performance metrics. The design reflects a professional, analytical style commonly used in presentations or reports. |
||||||||||||||||||||||||||||||||||||||||
Stockphotos.ro (c) 2025. All stock photos are provided by Dreamstime and are copyrighted by their respective owners. |