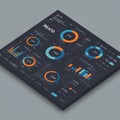
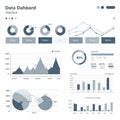
data visualization dashboard with various charts including bar graphs pie |
||||||||||||||||||||||||||||||||||||||||
navigate by keyword : widgets visualization vibrant variety trends tones text suitable structures strategically sets screenshot represent presentations presentation poster points pie percentages panels overview orange number multiple multimedia metrics logo line layered labeled insights indicating including gray graphs games gadget font features electronics displays diagram design data dashboard dark creating comprehensive circle charts chart centralized categories business brand blue bar background arranged analytical aigenerated advertising |
||||||||||||||||||||||||||||||||||||||||
|
||||||||||||||||||||||||||||||||||||||||
Data visualization dashboard with various charts including bar graphs, pie charts, and line graphs. Features a dark background with vibrant orange, blue, and gray tones. Displays layered 3D centralized data structures and labeled widgets with metrics and percentages. Contains multiple panels indicating data points, trends, and categories. Each chart variety is strategically arranged to represent different data sets and insights, creating a comprehensive overview suitable for analytical and business presentations. |
||||||||||||||||||||||||||||||||||||||||
Stockphotos.ro (c) 2025. All stock photos are provided by Dreamstime and are copyrighted by their respective owners. |