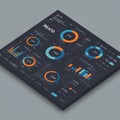
digital dashboard features multiple data visualization elements including pie charts |
||||||||||||||||||||||||||||||||||||||||
navigate by keyword : visualization text teal statistics smartphone sleek sets sections screenshot scheme providing prominently pie performance percentages overview organized orange numerical number multiple multimedia modern metrics lighting layout label indicators including graphs glance generated gadget font financial figures features elements electronics dollar displayed digital diagram design data dashboard dark consists comprehensive color circle charts brand blue bar analysis amounts aimed |
||||||||||||||||||||||||||||||||||||||||
|
||||||||||||||||||||||||||||||||||||||||
A digital dashboard features multiple data visualization elements, including pie charts, bar graphs, and numerical indicators. The color scheme consists of dark blue, orange, and teal. Various metrics and financial figures are displayed prominently, including percentages and dollar amounts. The layout is organized into sections with different data sets, providing an overview of performance statistics. The design is sleek and modern, aimed at providing comprehensive data analysis at a glance. |
||||||||||||||||||||||||||||||||||||||||
Stockphotos.ro (c) 2025. All stock photos are provided by Dreamstime and are copyrighted by their respective owners. |