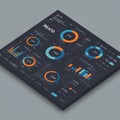
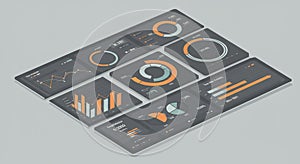
digital dashboard features various data visualization elements including bar graphs |
||||||||||||||||||||||||||||||||||||||||
navigate by keyword : visualization text teal spread sleek six shows separate screenshot scheme reporting rectangular purposes progress presentation pie percentages panels organized orange numerical number neatly multimedia modern metrics line lighting light label interpretation interface intended including includes gray graphs graphics generated gadget font features elements electronics efficient document digital diagram designed design data dashboard component color circular circle charts business brand bar background analytics advertising |
||||||||||||||||||||||||||||||||||||||||
|
||||||||||||||||||||||||||||||||||||||||
A digital dashboard features various data visualization elements, including bar graphs, line graphs, pie charts, and circular progress charts. The color scheme includes orange, gray, and teal. Each component shows different metrics, such as percentages and numerical data, spread across six separate rectangular panels. These graphics are neatly organized on a light gray background, designed for business analytics or reporting purposes. The interface has a modern, sleek design, intended for efficient data interpretation and presentation. |
||||||||||||||||||||||||||||||||||||||||
Stockphotos.ro (c) 2025. All stock photos are provided by Dreamstime and are copyrighted by their respective owners. |