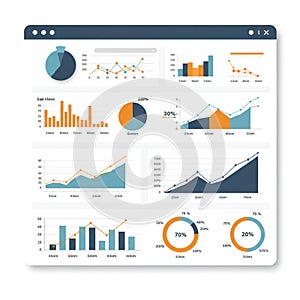
analytical dashboard displaying various data visualizations pie charts line graphs |
||||||||||||||||||||||||||||||||||||||||
navigate by keyword : window visualizations values used typical trends top time text show sections screenshot representing presentation points plan pie person percentage organized orange numerical multimedia mimics metrics marked logo line learning layout label intervals interface include illustrating icons grid graphs gadget frame font drawing doughnut document distinct displaying digital diagram design depict data dashboard control colors circular charts cartoon browserstyle brand blue bar analytical aigenerated advertising 30min |
||||||||||||||||||||||||||||||||||||||||
|
||||||||||||||||||||||||||||||||||||||||
Analytical dashboard displaying various data visualizations: pie charts, line graphs, bar charts, and doughnut charts. Colors used include blue and orange, illustrating different metrics and trends. The sections are organized in a grid layout, each representing distinct data points and numerical values. Circular charts show percentage data, while line and bar charts depict trends over time intervals marked as "20min," "30min," etc. A browser-style frame mimics a digital interface with typical window control icons on top. |
||||||||||||||||||||||||||||||||||||||||
Stockphotos.ro (c) 2025. All stock photos are provided by Dreamstime and are copyrighted by their respective owners. |