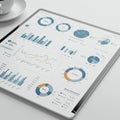
tablet screen displaying various data visualizations including bar charts line graphs |
||||||||||||||||||||||||||||||||||||||||
navigate by keyword : writing visualizations used typical trends tracking time text tablet software signage screen represents red professional presentation pie performance percentages multimedia minimalist metrics logo line like layout labels label interface indicative including includes growth graphs generated gadget forecasts forecasting font financial elements electronics dollars document displaying diagram design data dashboard colors clean charts chart business brand blue bar banner annuals analytics analytical analysis advertising |
||||||||||||||||||||||||||||||||||||||||
|
||||||||||||||||||||||||||||||||||||||||
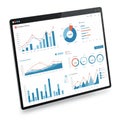
Tablet screen displaying various data visualizations, including bar charts, line graphs, and a pie chart. The data represents analytics and forecasts, with elements in blue and red colors. Text like "Analytics Annuals" and "Forecasting Dollars" suggest business or financial analysis. The interface includes labels, percentages, and metrics, indicative of a dashboard used for tracking performance, trends, and growth over time. The layout is clean and minimalist, typical of professional analytical software. |
||||||||||||||||||||||||||||||||||||||||
Stockphotos.ro (c) 2025. All stock photos are provided by Dreamstime and are copyrighted by their respective owners. |