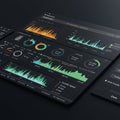
abstract interface digital dashboard featuring various data visualizations

navigate by keyword : visualizations vibrant values trends theme text teal suitable suggests structure status signage sets screenshot presents pie performance percentages organized orange numerical number multimedia monitoring metrics line like layout laptop labels interface insights indicators includes green graphs generated gadget functionality font featuring electronics displaying digital differentiate design deployment data dashboard dark configured colors charts business brand bar bandwidth analytics analytical abstract

Abstract interface of a digital dashboard featuring various data visualizations. Royalty Free Stock Photo
Futuristic interface featuring a digital dashboard with various data visualizations and Royalty Free Stock Photo
A digital dashboard interface displaying various data visualizations, including bar Royalty Free Stock Photo
Digital dashboard with a modern, minimalist design, featuring various data Royalty Free Stock Photo
Digital Interface Display with High-Tech Speedometer and Data Icons Royalty Free Stock Photo
Futuristic Data Visualization Interface Royalty Free Stock Photo
Abstract Data Visualization Grid Royalty Free Stock Photo
Abstract interface of a digital dashboard featuring various data visualizations.
Digital Interface Display with High-Tech Speedometer and Data Icons Royalty Free Stock Photo
Dark Mode Dashboard Interface Royalty Free Stock Photo
Vibrant Digital Cloud Workspace Dashboard With Graphs and Analytics Displays Royalty Free Stock Photo
Futuristic Digital Interface With Complex Data Visualization For Business Analysis And Technology Concept Royalty Free Stock Photo
Futuristic HUD Interface Featuring Data Visualizations, Graphs, and Charts Royalty Free Stock Photo
Abstract Tech Interface Royalty Free Stock Photo
Abstract interface of a digital dashboard featuring various data visualizations. Includes bar graphs, pie charts, and line graphs configured on a dark theme. Vibrant colors such as orange, green, and teal differentiate data sets. The layout presents an organized structure with labels, numerical values, and percentages for analytical insights. The design suggests functionality for monitoring metrics like deployment status and bandwidth. Suitable for business analytics, displaying data trends and performance indicators.


Stockphotos.ro (c) 2025. All stock photos are provided by Dreamstime and are copyrighted by their respective owners.