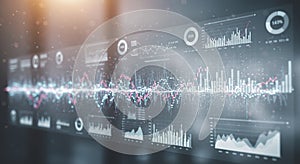
digital dashboard displaying various data visualizations including bar charts line |
||||||||||||||||||||||||||||||||||||||||
navigate by keyword : white visualizations visible text technological suited suggesting statistical stage specific sleek signage screenshot red presents presentation poster points pie performance percentages night music modern metrics line like lighting light interface indicating including highlighting graphs graph generated font financial feature environments entertainment elements displaying digital design data dashboard darkness dark crowd concert colors circular charts business bright brand blurred blue bar background analytical analysis aigenerated advertising |
||||||||||||||||||||||||||||||||||||||||
|
||||||||||||||||||||||||||||||||||||||||
Digital dashboard displaying various data visualizations, including bar charts, line graphs, and pie charts. The charts feature bright colors like red, blue, and white against a dark, blurred background. Each graph presents statistical data, possibly related to financial or business metrics. Circular elements indicating percentages are also visible, highlighting specific data points. The design is sleek and modern, suggesting an advanced data analysis or AI-generated interface, suited for analytical or technological environments. |
||||||||||||||||||||||||||||||||||||||||
Stockphotos.ro (c) 2025. All stock photos are provided by Dreamstime and are copyrighted by their respective owners. |