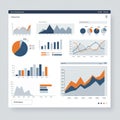
digital dashboard displaying various data visualizations including pie charts line |
||||||||||||||||||||||||||||||||||||||||
navigate by keyword : visualizations use tools text technological teal surrounding suggesting strategically stage sizes signage sharp sets screenshot resembles represent red purple presentation poster pie number line like layout interpretation indicating including includes hightech graphs giving generated games gadget futuristic font feel displaying digital details design datasets data dashboard dark context comparative colors circuit charts brand board blue black bar banner background art arranged area analytics analysis advertising advanced adding |
||||||||||||||||||||||||||||||||||||||||
|
||||||||||||||||||||||||||||||||||||||||
Digital dashboard displaying various data visualizations, including pie charts, line graphs, and bar charts, on a dark background. The charts use colors like blue, red, and teal to represent different data sets. The layout includes charts of different sizes arranged strategically, suggesting comparative analysis of datasets. The details are sharp, giving a futuristic and high-tech feel, indicating the use of advanced analytics tools for data interpretation. The surrounding area resembles a circuit board, adding a technological context. |
||||||||||||||||||||||||||||||||||||||||
Stockphotos.ro (c) 2025. All stock photos are provided by Dreamstime and are copyrighted by their respective owners. |