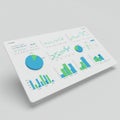
sleek digital dashboard displays various data visualizations including bar graphs |
||||||||||||||||||||||||||||||||||||||||
navigate by keyword : writing white wellorganized visualizations visible typical tools tones text subtle specific small sleek signage reporting providing presentation poster pie percentages panels numerous multimedia modern making look location line lighting layout label interpret interface information including illustrate highlight gray graphs gadget font financial easy drawing document displays digital design datasets data dashboard comprehensive complex comparative clean circular charts business |
||||||||||||||||||||||||||||||||||||||||
|
||||||||||||||||||||||||||||||||||||||||
A sleek digital dashboard displays various data visualizations, including bar graphs, pie charts, and line graphs. The interface is predominantly white with subtle gray tones, providing a modern and clean look. Circular charts highlight percentages, while bar graphs illustrate comparative data. The layout is well-organized, making it easy to interpret complex datasets. Numerous small panels of information suggest comprehensive analytics, typical of financial or business reporting tools. No specific location or branding is visible. |
||||||||||||||||||||||||||||||||||||||||
Stockphotos.ro (c) 2025. All stock photos are provided by Dreamstime and are copyrighted by their respective owners. |