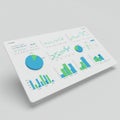
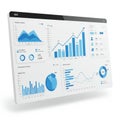
digital dashboard displays various data visualizations including pie charts bar |
||||||||||||||||||||||||||||||||||||||||
navigate by keyword : visually visualizations trends textured text tabletlike surface sleek signage show screenshot resting purple presented presentation poster pie performance number neonblue multimedia metrics manner logo lighting light information including illustrating hightech graphs glow gadget futuristic font engaging displays digital digit device design data dashboard darkness dark comparisons circular charts brand blue black bar analytics aigeneratedal aigenerated advertising |
||||||||||||||||||||||||||||||||||||||||
|
||||||||||||||||||||||||||||||||||||||||
A digital dashboard displays various data visualizations, including pie charts, bar graphs, and circular graphs, all in a futuristic, neon-blue glow. Information is presented in a sleek, high-tech tablet-like device resting on a textured, dark surface. The graphs show different metrics, possibly related to analytics or performance data, illustrating trends and comparisons in a visually engaging manner. |
||||||||||||||||||||||||||||||||||||||||
Stockphotos.ro (c) 2025. All stock photos are provided by Dreamstime and are copyrighted by their respective owners. |