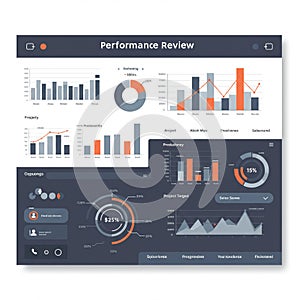
performance review dashboard featuring various charts and graphs includes bar |
||||||||||||||||||||||||||||||||||||||||
navigate by keyword : visualization user tones text targets shows sections screenshot scheme sales review project progress productivity presentation performance percentage orange objectives neatly multimedia logo line levels label interface interaction integrating insights indicator includes icons gray graphs generated gadget font figures featuring features elements electronics donut document displaying diagram design data dashboard comprehensive communication color circular charts chart brand blue bar arranged advertising |
||||||||||||||||||||||||||||||||||||||||
|
||||||||||||||||||||||||||||||||||||||||
Performance review dashboard featuring various charts and graphs. Includes bar charts, line graphs, and a donut chart displaying data such as sales, project targets, and productivity levels. Color scheme primarily uses blue, gray, and orange tones. Elements are neatly arranged with sections for project progress, sales figures, and objectives. Circular progress indicator shows a percentage, integrating data visualization elements for comprehensive performance insights. User interface features icons for communication and interaction. |
||||||||||||||||||||||||||||||||||||||||
Stockphotos.ro (c) 2025. All stock photos are provided by Dreamstime and are copyrighted by their respective owners. |