dashboard featuring dark themed interface with various data visualizations

navigate by keyword : white visualizations understanding track text team segments sections screenshot rows review providing productivity presentation poster point pie performance percentages palette overview organized orange one numerical number multimedia milestones metrics messages line like layout labeled key interface includes highlight graphs generated games gadget font featuring electronics ease document displays differentiation diagram design data dashboard darkthemed

Dashboard featuring a dark-themed interface with various data visualizations. Royalty Free Stock Photo
Dark-themed digital dashboard interface featuring various data visualizations. Royalty Free Stock Photo
Dark-themed digital financial dashboard featuring various data visualizations, Royalty Free Stock Photo
Dark-themed digital dashboard featuring various data visualizations, including line Royalty Free Stock Photo
Isometric dashboard design with dark-themed interface showcasing various Royalty Free Stock Photo
   
   
Dashboard featuring a dark-themed interface with various data visualizations.
Dashboard interface featuring multiple data visualizations. Central 3D layered chart i Royalty Free Stock Photo
Digital dashboard interface for a Customer Relationship Management (CRM) tool, Royalty Free Stock Photo
   
Laptop displaying data dashboard with charts and graphs, showing analytics Royalty Free Stock Photo
Financial Analytics Dashboard On Screen, Data Visualization Royalty Free Stock Photo
Dark Theme Tech Workspace with Multiple Screens Royalty Free Stock Photo
Dark Mode Dashboard Interface Royalty Free Stock Photo
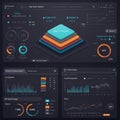
Dashboard featuring a dark-themed interface with various data visualizations. Displays bar charts, line graphs, and pie charts to track metrics like productivity, milestones, and performance. Key sections highlight percentages and numerical data. Uses a color palette of blue, orange, and white for differentiation. Includes labeled segments such as "One Point Messages" and "Complex Review." Layout organized into rows and columns for clarity and ease of understanding, providing a comprehensive overview of team performance metrics.


Stockphotos.ro (c) 2025. All stock photos are provided by Dreamstime and are copyrighted by their respective owners.