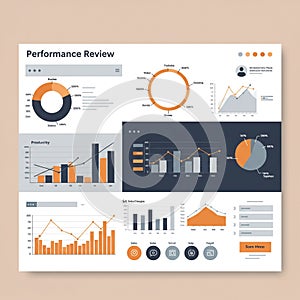
performance review dashboard featuring various data visualizations includes pie |
||||||||||||||||||||||||||||||||||||||||
navigate by keyword : visualizations trends timelines text targets structured screenshot sales review rectangular progress productivity presentation poster plan pie performance percentages orange neutral multimedia months metrics logo line like learning layout information includes icons hues gray graphs goal generated gadget font featuring drawing document dissemination displays diagram detail design data dashboard clear circular charts categories cartoon brand bottom black bar background advertising achievements |
||||||||||||||||||||||||||||||||||||||||
|
||||||||||||||||||||||||||||||||||||||||
Performance review dashboard featuring various data visualizations. Includes pie charts, bar graphs, and line graphs in orange, black, and gray hues. Displays metrics like sales, productivity, and targets across different timelines. Circular and rectangular graphs detail progress percentages, goal achievements, and trends over months. Icons at the bottom suggest categories like sales and targets. Layout is structured for clear information dissemination on a neutral background. |
||||||||||||||||||||||||||||||||||||||||
Stockphotos.ro (c) 2025. All stock photos are provided by Dreamstime and are copyrighted by their respective owners. |