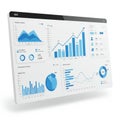
modern dashboard displays various data visualizations including bar charts line graphs and pie shades blue |
||||||||||||||||||||||||||||||||||||||||
navigate by keyword : abstract analysis analytics blue business charts clean control corporate dashboard data digital display economy finance generative graphic graphs growth information innovation intelligence interface management market metrics modern monitoring performance planning professional progress render report screen sleek statistics technology trend visualization |
||||||||||||||||||||||||||||||||||||||||
|
||||||||||||||||||||||||||||||||||||||||
A modern dashboard displays various data visualizations including bar charts, line graphs, and pie charts in shades of blue. Generative AI |
||||||||||||||||||||||||||||||||||||||||
Stockphotos.ro (c) 2025. All stock photos are provided by Dreamstime and are copyrighted by their respective owners. |