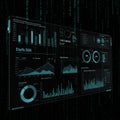
futuristic digital dashboard with data visualizations including line graphs bar charts |
||||||||||||||||||||||||||||||||||||||||
navigate by keyword : world visualizations types trends text technology suggesting structured signage sign separate sections screenshot presentation poster pie organized numerical number neon multimedia metrics market map line light layout interface including hightech graphs giving gadget futuristic font financial electronics displays digital design data dashboard dark charts brand blue bar background appearance analytics analysis aigenerated advertising advanced accents |
||||||||||||||||||||||||||||||||||||||||
|
||||||||||||||||||||||||||||||||||||||||
Futuristic digital dashboard with data visualizations, including line graphs, bar charts, pie charts, and a world map. The interface displays various metrics, trends, and analytics. The design uses a dark background with neon blue accents, suggesting advanced data analysis and technology. The layout is structured with separate sections for different types of data, giving a high-tech, organized appearance. Displays numerical data related to financial or market analytics. |
||||||||||||||||||||||||||||||||||||||||
Stockphotos.ro (c) 2025. All stock photos are provided by Dreamstime and are copyrighted by their respective owners. |