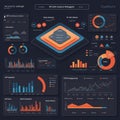
digital dashboard featuring data visualizations including bar graphs line charts and |
||||||||||||||||||||||||||||||||||||||||
navigate by keyword : visualizations typically text surrounding statistical sleek sets screenshot presented presentation poster points pie overview organized number night logo lines line light layout interpretation interface including graphs futuristic font financial featuring facilitate elements easy digital diagram design data dashboard darkness creating contexts connected comprehensive complex circuitlike charts cartoon business brand bluetone blue bar analytical aigenerated advertising |
||||||||||||||||||||||||||||||||||||||||
|
||||||||||||||||||||||||||||||||||||||||
Digital dashboard featuring data visualizations including bar graphs, line charts, and pie charts. The design is presented in a sleek blue-tone interface with futuristic, circuit-like elements surrounding the graphs. Data points appear connected by lines, creating a comprehensive analytical overview typically seen in financial, statistical, or business contexts. The layout is organized to facilitate easy interpretation of complex data sets. |
||||||||||||||||||||||||||||||||||||||||
Stockphotos.ro (c) 2025. All stock photos are provided by Dreamstime and are copyrighted by their respective owners. |