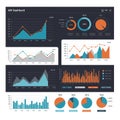
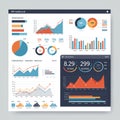
dashboard layout featuring various data visualizations including bar charts line |
||||||||||||||||||||||||||||||||||||||||
navigate by keyword : visualizations tool text suggesting stylized simulating shapes shades sections screenshot representation rendered red presentation poster pie percentages orange number multimedia logo line layout layered labels interface incorporates including includes illegible headers graphs geometric games gadget font focus figures featuring electronics displayed digital diagram design data dashboard dark circle charts brand blue blend bar background analytics aigenerated aesthetics advertising |
||||||||||||||||||||||||||||||||||||||||
|
||||||||||||||||||||||||||||||||||||||||
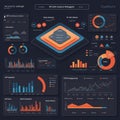
Dashboard layout featuring various data visualizations, including bar charts, line graphs, pie charts, and 3D layered charts. Displayed on a dark background, the charts are rendered in shades of orange, blue, and red. The interface includes sections with labels, percentages, and figures, simulating an analytics tool. The design incorporates a blend of geometric shapes and text headers. Includes a blend of illegible and stylized text suggesting a focus on aesthetics for digital analytics representation, possibly AI-generated. |
||||||||||||||||||||||||||||||||||||||||
Stockphotos.ro (c) 2025. All stock photos are provided by Dreamstime and are copyrighted by their respective owners. |