digital dashboard featuring data visualizations including bar graphs line charts |
||||||||||||||||||||||||||||||||||||||||
navigate by keyword : visualizations varying used text style small sleek signage showcases show sections screenshot reporting purple progress presentation poster percentages multimedia modern line likely like layout label indicators including icons heights graphs gradients gadget futuristic font featuring enhance elements document display digital diagram design data dashboard dark cohesive circular charts cartoon business brand blue blends bar banner background analytics analytical aigenerated |
||||||||||||||||||||||||||||||||||||||||
|
||||||||||||||||||||||||||||||||||||||||
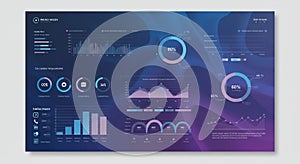
A digital dashboard featuring data visualizations, including bar graphs, line charts, and circular progress indicators. The background blends dark blue with purple gradients. Circular charts show percentages like 80% and 60%, while bar charts display data with varying heights. Line graphs and small icons enhance the analytical design. Text elements label various sections in a sleek, modern font. The layout showcases a cohesive and futuristic style, likely used for business analytics or reporting. |
||||||||||||||||||||||||||||||||||||||||
Stockphotos.ro (c) 2025. All stock photos are provided by Dreamstime and are copyrighted by their respective owners. |