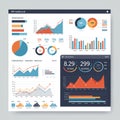
kpi dashboard featuring various data visualizations including line graphs bar charts |
||||||||||||||||||||||||||||||||||||||||
| navigate by keyword : visualizations variables time text shades segmented screenshot scheme presentation poster points pie performance percentage pattern organized orange multimedia months monitoring metrics logo line layout labeled kpi indicators including illustrate gray graphs generated gadget font featuring effectively drawing document distributions display differentiation diagram designed design depict data dashboard contrasting consists comparisons colors color clear circle charts categorized categories cartoon blue |
||||||||||||||||||||||||||||||||||||||||
|
||||||||||||||||||||||||||||||||||||||||
| KPI dashboard featuring various data visualizations, including line graphs, bar charts, and pie charts. The color scheme consists of shades of blue, orange, and gray. Graphs display metrics over time, segmented by months and categorized across different variables. Pie charts illustrate percentage distributions, while bar charts depict comparisons of data points. The layout is organized and clear, with categories labeled in contrasting colors for better differentiation. The dashboard is designed for monitoring performance indicators effectively. |
||||||||||||||||||||||||||||||||||||||||
|
Stockphotos.ro (c) 2025. All stock photos are provided by Dreamstime and are copyrighted by their respective owners. |
||||||||||||||||||||||||||||||||||||||||