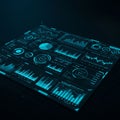
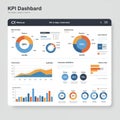
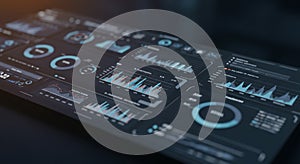
digital dashboard featuring various data visualization elements includes bar charts |
||||||||||||||||||||||||||||||||||||||||
navigate by keyword : visualization timestamps text techdriven suggests software smartphone signage screenshot red quantitative pie perspective performance overview offering number neatly multimedia monitoring metrics line lighting layout labeled key interface intelligence indicators includes graphs generated gadget futuristic font featuring enhance elements electronics display dim digital diagrams design data dashboard dark color circular charts business brand blue black bar arranged angled analytical aesthetic advertising accents |
||||||||||||||||||||||||||||||||||||||||
|
||||||||||||||||||||||||||||||||||||||||
Digital dashboard featuring various data visualization elements. Includes bar charts, line graphs, pie charts, and circular diagrams arranged neatly on a dark interface. The graphs display quantitative data with color accents of blue and red, all labeled with corresponding metrics and timestamps. The layout suggests analytical software for monitoring or business intelligence, offering an overview of key performance indicators. The angled perspective and dim lighting enhance the tech-driven, futuristic aesthetic. |
||||||||||||||||||||||||||||||||||||||||
Stockphotos.ro (c) 2025. All stock photos are provided by Dreamstime and are copyrighted by their respective owners. |