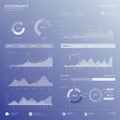
digital dashboard interface with charts graphs and user interaction |
||||||||||||||||||||||||||||||||||||||||
navigate by keyword : writing user text screenshot presentation poster play number multimedia logo line interface interaction graphs font drawing document digital diagram design dashboard charts cartoon brand advertising data visualization analytics business bar chart graph pie analysis blue clean modern display interactive hand monitoring artwork technology system information concept layout driven |
||||||||||||||||||||||||||||||||||||||||
|
||||||||||||||||||||||||||||||||||||||||
Digital dashboard interface featuring various data visualization elements. Includes bar graphs, line charts, and a pie chart. A hand interacts using touch input on a blue background. Central figures include "12,310," displayed prominently in a rectangular section. Other elements consist of rectangular panels containing charts and data points arranged in a grid format. Smooth, modern design suggests a user-friendly, interactive experience typical in business or analytics software. |
||||||||||||||||||||||||||||||||||||||||
Stockphotos.ro (c) 2025. All stock photos are provided by Dreamstime and are copyrighted by their respective owners. |