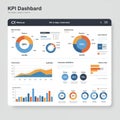
digital kpi dashboard featuring various data visualization elements includes pie |
||||||||||||||||||||||||||||||||||||||||
| navigate by keyword : witz website visualization trends tracking text template suggesting showing sections screenshot satisfaction revenue presentation plan placeholders pie performance percentages orange multimedia mix metrics logo line learning labels labeled label kpi intended includes illustrate gray graphs generated gadget font featuring elements document distributions displays digital diagram design data dashboard customer charts business brand blue bar |
||||||||||||||||||||||||||||||||||||||||
|
||||||||||||||||||||||||||||||||||||||||
| A digital KPI dashboard featuring various data visualization elements. Includes pie charts, bar graphs, and line graphs in blue, orange, and gray. Displays sections labeled "Revenue," "Customer Satisfaction," and "Website Witz." Graphs illustrate percentages and trends, with a mix of charts showing distributions and metrics. Text and labels appear as placeholders, suggesting an AI-generated design template intended for business analytics and performance tracking. |
||||||||||||||||||||||||||||||||||||||||
|
Stockphotos.ro (c) 2025. All stock photos are provided by Dreamstime and are copyrighted by their respective owners. |
||||||||||||||||||||||||||||||||||||||||