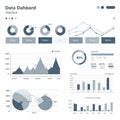
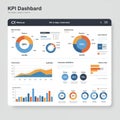
data visualization dashboard featuring mix bar graphs line charts pie and |
||||||||||||||||||||||||||||||||||||||||
| navigate by keyword : white visualization varying trends time text signage show sections screenshot right representing purple presentation poster positioned points pie performance percentages multimedia monthly mix metrics lines line likely left learning key intersecting insights indicators include icons highlighting heights headings graphs generated gadget font featuring electronics dominant document diagram design depict data dashboard colors charts brand blue bar background analytical advertising |
||||||||||||||||||||||||||||||||||||||||
|
||||||||||||||||||||||||||||||||||||||||
| Data visualization dashboard featuring a mix of bar graphs, line charts, pie charts, and icons. Dominant colors include blue and purple against a white background. The bar graphs on the left depict monthly data with varying heights. Line graphs on the right show trends over time with intersecting lines and data points. Pie charts and icons representing metrics are positioned throughout. Text sections include headings and percentages, likely highlighting key performance indicators and analytical insights. |
||||||||||||||||||||||||||||||||||||||||
|
Stockphotos.ro (c) 2025. All stock photos are provided by Dreamstime and are copyrighted by their respective owners. |
||||||||||||||||||||||||||||||||||||||||