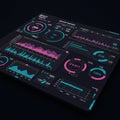
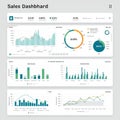
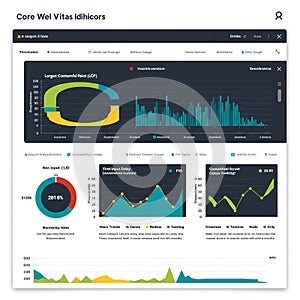
dashboard with various graphs and charts displaying data metrics features include |
||||||||||||||||||||||||||||||||||||||||
navigate by keyword : yellows website web visualizing used time text tailored settings search screenshot scheme scenarios reds randomized presentation present poster plan placeholder performance percentage paint nonsensical multimedia monitoring metrics logo line learning largest labels interface insights input indicating includes include illustrating icons graphs generated gadget font features elements document displaying diagram design delay data dashboard dark contentful conceptual color circular charts chart brand blues bar background analytical |
||||||||||||||||||||||||||||||||||||||||
|
||||||||||||||||||||||||||||||||||||||||
Dashboard with various graphs and charts displaying data metrics. Features include a circular chart with percentage data, bar graphs, and line graphs illustrating performance over time. Labels contain randomized or nonsensical text, indicating a placeholder or conceptual design. Color scheme includes blues, yellows, and reds against a dark background. Used for visualizing web performance metrics such as "Largest Contentful Paint" and "First Input Delay." Interface elements present: search bar, icons for settings. Tailored for analytical insights in performance monitoring scenarios. |
||||||||||||||||||||||||||||||||||||||||
Stockphotos.ro (c) 2025. All stock photos are provided by Dreamstime and are copyrighted by their respective owners. |